Issues Analytics [PREMIUM]
Introduced in GitLab Premium 11.5.
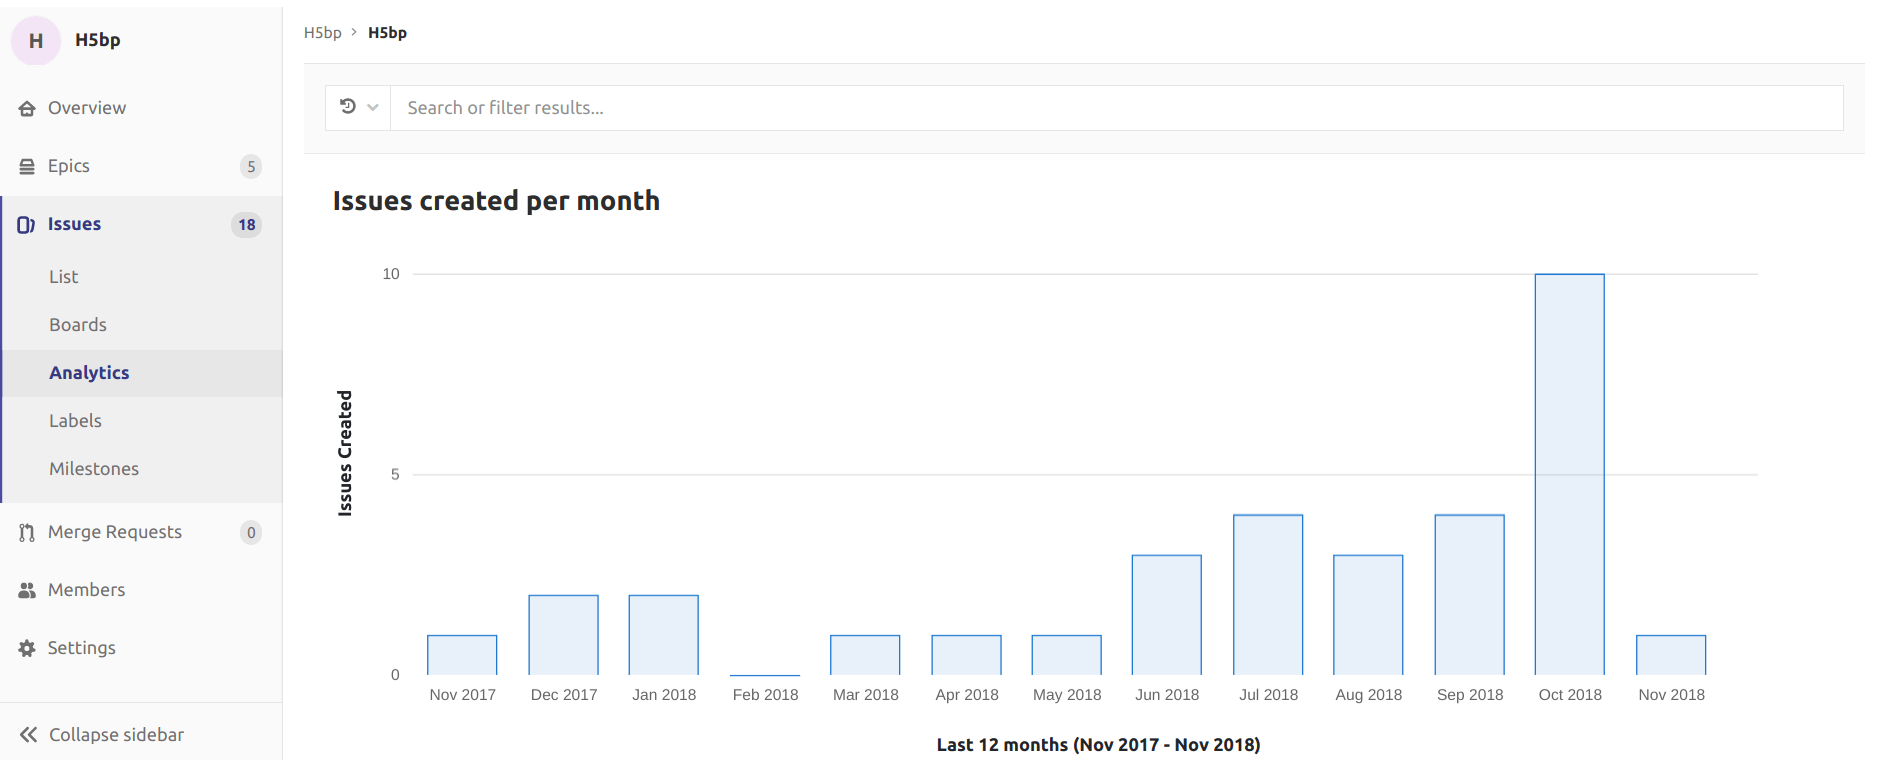
GitLab by default displays a bar chart of the number of issues created each month, for the current month, and 12 months prior, for a total of 13 months.
You can change the total number of months displayed by setting a URL parameter.
For example, https://gitlab.com/groups/gitlab-org/-/issues_analytics?months_back=15
would show a total of 15 months for the chart in the GitLab.org group.
The Search or filter results... field can be used for filtering the issues by any attribute. For example, labels, assignee, milestone, and author.
To access the chart, navigate to a group's sidebar and select Issues > Analytics.